



































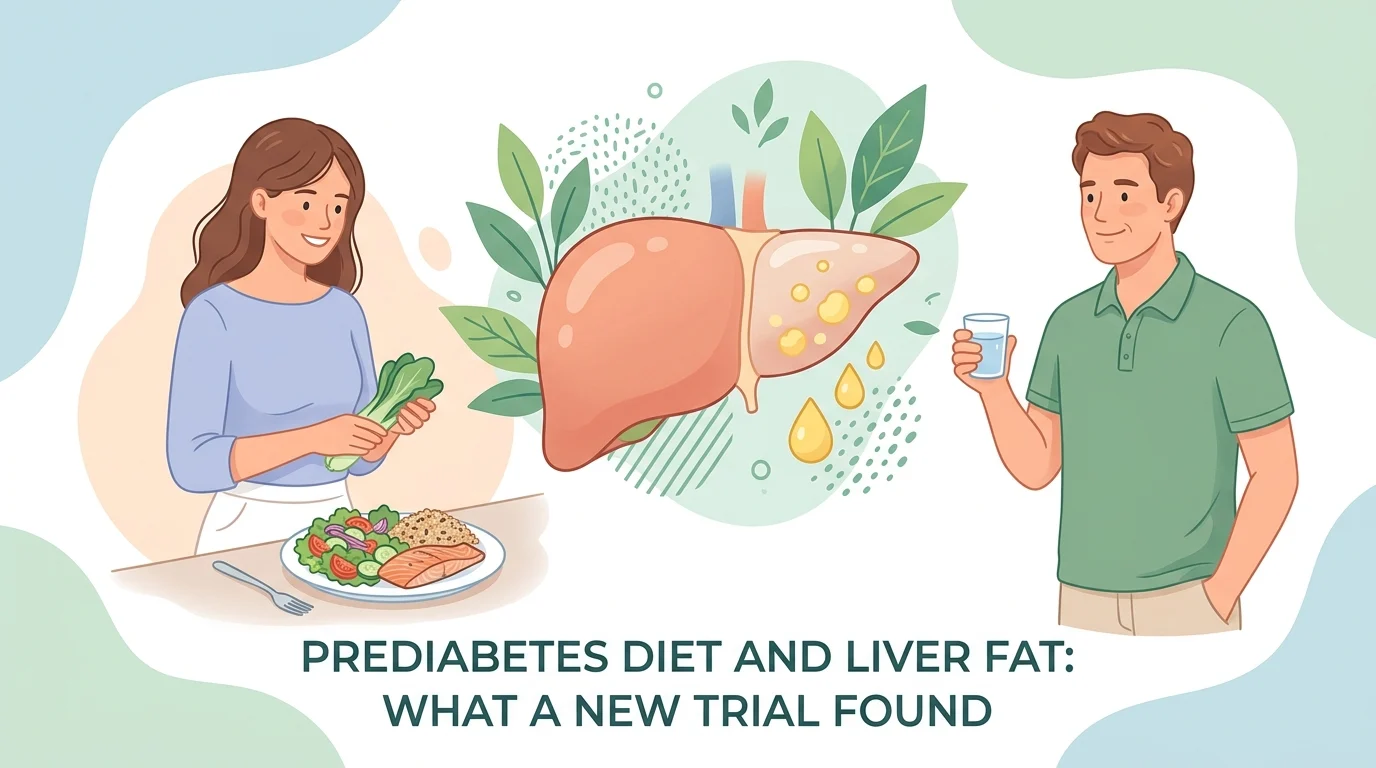
عادةً ما يُقيَّم النظام الغذائي لمقدمات السكري بالرقم الذي يظهر على الميزان، غير أن تجربة عشوائية نُشرت في 27 أغسطس 2026 في مجلة Cell Metabolism تُشير إلى أن تركيبة هذا النظام الغذائي تؤثر أيضاً فيما يظهر في نتائج فحوصات الدم. أجرى فريق من كلية الطب بجامعة واشنطن في سانت لويس دراسةً على 42 بالغاً يعانون من السمنة ومقدمات السكري وتراكم الدهون في الكبد، إذ خُصِّص لكل منهم أحد ثلاثة أنظمة غذائية: الكيتوجيني، أو المتوسطي، أو قليل الدهون ونباتي التوجه. وقد ضُبطت السعرات الحرارية بحيث يفقد كل مجموعة نحو 10% من وزن الجسم خلال أربعة إلى خمسة أشهر. كان فقدان الوزن متساوياً بين المجموعات، أما نتائج الفحوصات المخبرية فلم تكن كذلك. في هذا المقال ستتعرف على المؤشرات التي شهدت أكبر تغيير، وكيفية قراءة هذه القيم في تقريرك الخاص، وأين لا تزال الأدلة العلمية قاصرة.
ما الذي قارنته تجربة النظام الغذائي لمقدمات السكري فعلاً
تُوصى بالأنظمة الغذائية الثلاثة عادةً لفقدان الوزن، ولم يكن واضحاً حتى الآن ما إذا كان أيٌّ منها يُقدّم ميزةً استقلابية تتجاوز الوزن المفقود. تباينت الأنظمة الثلاثة تبايناً واضحاً في تركيبتها؛ إذ اعتمد النظام الكيتوجيني على 4% فقط من السعرات من الكربوهيدرات و73% من الدهون، فيما اعتمد النظام المتوسطي على 50% من الكربوهيدرات و35% من الدهون، أما النظام قليل الدهون ونباتي التوجه فاعتمد على 70% من الكربوهيدرات و15% من الدهون.
كان فريق البحث يُوفّر جميع الوجبات، وكان المشاركون يلتقون بأخصائي تغذية أسبوعياً. هذا المستوى من الضبط أمر غير معتاد، وهو ما يجعل المقارنة ذات قيمة: إذ إن ضبط السعرات الحرارية بحيث تصل كل مجموعة إلى نفس نسبة فقدان الوزن (10%) يعني أن أي فارق بين المجموعات يعكس تأثير تركيبة النظام الغذائي لا تأثير فقدان الوزن. وهذا في الوقت ذاته القيد الرئيسي للدراسة؛ فاثنان وأربعون شخصاً عينةٌ صغيرة، كما أن تلقّي وجبات جاهزة لمدة خمسة أشهر لا يعكس نمط الأكل في الحياة اليومية.
القياسات التي شهدت أكبر تغيير
انخفضت دهون الجسم في المجموعات الثلاث، وتحسّنت حساسية الأنسولين في جميعها. بدأ الفارق يظهر في الكبد وفي تنظيم مستوى الجلوكوز.
| النتيجة بعد 4-5 أشهر | الكيتوجيني | المتوسطي | قليل الدهون ونباتي التوجه |
|---|---|---|---|
| الوزن المفقود | نحو 10% | نحو 10% | نحو 10% |
| انخفاض دهون الكبد | 67% في المتوسط | 45% في المتوسط | 45% في المتوسط |
| لم تعد تنطبق عليهم معايير مقدمات السكري | نحو 50% من المشاركين | 29% من المشاركين | 7% من المشاركين |
| الأنسولين في الدم على مدار 24 ساعة | أكبر انخفاض | نتيجة متوسطة | أصغر انخفاض |
| الكوليسترول والدهون في الدم | لا ارتفاع رغم أعلى نسبة تناول للدهون | لم يُرصد أي تغيير سلبي | لم يُرصد أي تغيير سلبي |
الصف الثاني من ذلك الجدول هو الأهم لكل من يحمل تقرير تحاليل. الخروج من نطاق مقدمات السكري ليس تحسناً نسبياً — بل هو تجاوز لعتبة محددة بأرقام تطبعها المختبرات. نصف المجموعة التي اتبعت النظام الكيتوني تجاوزت هذه العتبة مجدداً في أقل من خمسة أشهر.
لماذا تتحرك دهون الكبد وسكر الدم معاً
كبد الشخص البالغ السليم لا يحتوي إلا على كميات ضئيلة جداً من الدهون. وحين تتراكم الدهون فيه، يصبح الكبد أقل استجابةً للأنسولين، فيزيد البنكرياس من إفرازه، وهذا الأنسولين الزائد بدوره يدفع الكبد إلى تخزين المزيد من الدهون. هذه الحلقة تُغذّي نفسها بنفسها، مما يفسر سبب إدراج المعهد الوطني للسكري وأمراض الهضم والكلى (NIDDK) للسمنة والمتلازمة الأيضية والسكري من النوع الثاني ضمن الحالات التي تزيد من احتمالية الإصابة بمرض الكبد الدهني.
في التجربة، أظهرت المجموعة الكيتونية أكبر ارتفاع في الغلوكاغون، وهو هرمون يحفّز الكبد على إطلاق الدهون المخزنة، إلى جانب أكبر انخفاض في مستوى الأنسولين المتداول في الدم. كلا التغييرين يسيران في الاتجاه ذاته: إشارة أضعف لتخزين الدهون في الكبد، وإشارة أقوى لإزالتها. وهذه آلية محتملة لا مثبتة، وقد قدّمها المؤلفون على هذا الأساس.
الكبد الدهني عادةً لا يُسبب أعراضاً، ولهذا يُكتشف في الغالب عبر تحاليل الدم الروتينية لا من خلال الأعراض. إذا أثارت نتائجك هذا التساؤل، يمكن للطبيب أن يطلب تحليل دم للكبد الدهنيمقال آخر في هذا الموقع يتناول المنطقة الرمادية لـ A1c في مقدمات السكري.
قراءة نتائجك بعد تغيير نظامك الغذائي في مرحلة مقدمات السكري
ثلاثة قيم مخبرية تحدد نطاق مقدمات السكري، وهي الأرقام التي تستحق المتابعة إذا غيّرت نظامك الغذائي. وفقاً لمراكز السيطرة على الأمراض والوقاية منها (CDC)، تُعدّ نسبة A1C أقل من 5.7% طبيعية، ومن 5.7% إلى 6.4% تشير إلى مقدمات السكري، أما 6.5% فأكثر فتشير إلى السكري. وتحدد مايو كلينيك قيم سكر الصيام على النحو التالي: أقل من 100 ملغ/ديسيلتر طبيعي، ومن 100 إلى 125 ملغ/ديسيلتر يدل على مقدمات السكري، أما 126 ملغ/ديسيلتر فأكثر في اختبارين منفصلين فيدل على السكري. وفي اختبار تحمّل الغلوكوز لمدة ساعتين، تقع القراءة بين 140 و199 ملغ/ديسيلتر ضمن نطاق مقدمات السكري.
التوقيت لا يقل أهمية عن العتبة. يعكس A1C ما يقارب الثلاثة أشهر الماضية، لذا فإن نظاماً غذائياً بدأته قبل ستة أسابيع لن يظهر أثره بالكامل بعد. أما سكر الصيام فيستجيب بسرعة أكبر، لكنه يتذبذب من يوم لآخر، ولهذا نادراً ما تحسم قراءة واحدة الأمر. إذا أردت مراجعة النطاقات المرجعية جنباً إلى جنب، يفيدك الاطلاع على نطاقات سكر الصيام الطبيعية. لتحويل نسبة مئوية إلى رقم متوسط الجلوكوز، يلجأ كثير من الناس إلى استشارة جدول تحويل HbA1c.
تتحرك مؤشرات الكبد وفق جدولها الزمني الخاص. قد يتضمن تقريرك فحصاً شاملاً لوظائف الكبد، ويتابع الأطباء عادةً مستويات ALT لأن هذا الإنزيم يرتفع حين تتعرض خلايا الكبد للضغط. وللتمييز بين أنماط إصابة الكبد، تحسب بعض المختبرات أيضاً نسبة AST/ALT. يظهر الجلوكوز عادةً في لوحة الأيض الشاملة، والذي كثيراً ما يُطلب جنباً إلى جنب مع المستويات الطبيعية للدهون الثلاثية.
ثمة تحفظ مهم لا تزيله هذه التجربة: قد تكون نتيجة A1C مضللة في بعض الحالات. تُدرج مراكز السيطرة على الأمراض والوقاية منها (CDC) ضمن الحالات التي تُشوّه النتيجة: فقر الدم الحاد، والفشل الكلوي، وأمراض الكبد، وبعض اضطرابات الهيموغلوبين، وفقدان الدم الحديث، والحمل. فإذا جاء الرقم غير متوافق مع الصورة السريرية، فالأجدر إعادة الفحص لا التصرف بناءً عليه وحده.
أحدث التطورات العلمية
تأتي تجربة Cell Metabolism في مجال شهد تطوراً متسارعاً خلال السنوات الثلاث الماضية. وثمة أربعة نتائج تساعد على وضعها في سياقها الصحيح.
تجربة عشوائية مدتها 12 شهراً أُجريت في السويد تحت اسم NAFLDiet، تابعت 150 بالغاً يعانون من مقدمات السكري أو السكري من النوع الثاني. ما توصلت إليه: أن كلاً من النظام الغذائي منخفض الكربوهيدرات الغني بالدهون غير المشبعة المتعددة، والنظام الغذائي الشمالي الصحي منخفض الدهون، أدّيا إلى تقليل دهون الكبد مقارنةً بالرعاية المعتادة، دون أن يتفوق أحدهما على الآخر في هذا المقياس تحديداً. غير أن النظام الشمالي ذهب أبعد من ذلك، إذ حسّن أيضاً وزن الجسم، والتحكم في الجلوكوز على المدى البعيد، وإنزيمات الكبد، والدهون الثلاثية، ومؤشرات الالتهاب. ما يعنيه هذا بالنسبة لك: تقليل الكربوهيدرات هو أحد السبل للحد من دهون الكبد، لكنه ليس السبيل الوحيد — وفي تلك التجربة بدا الخيار الغني بالنباتات جيداً على الأقل بشكل عام.
دراسة ألمانية تُعرف بـ PLIS، جرى التحقق منها لاحقاً مقابل برنامج الوقاية من السكري الأمريكي الكبير، سألت: ما الذي يُفرّق بين من تعود أرقامهم إلى الطبيعي ومن يفقدون الوزن ذاته دون أن تتحسن قيمهم؟ ما توصلت إليه: أن من أعادوا مستوى الجلوكوز الصيامي، وجلوكوز ساعتين، وA1C إلى النطاق الطبيعي، كانت احتمالية إصابتهم بالسكري من النوع الثاني خلال العامين التاليين أقل بكثير — بنحو ثلاثة أرباع. وما ميّزهم هو تحسّن حساسية الأنسولين وانخفاض الدهون الحشوية — الدهون العميقة المحيطة بالأعضاء — لا زيادة إنتاج البنكرياس للأنسولين. ما يعنيه هذا بالنسبة لك: قد يفقد شخصان الوزن ذاته تماماً ويجدان أنفسيهما في مكانين بيولوجيين مختلفين تماماً، وفحص الدم هو ما يكشف هذا الفارق.
أكدت دراسة متابعة لبرنامج الوقاية من السكري هذه النقطة بصورة أوضح. ما توصلت إليه: بين الأشخاص الذين فقدوا أكثر من 7% من وزن أجسامهم، كان الذين عادت مستويات الجلوكوز لديهم إلى الطبيعي أيضاً أقل عرضةً للإصابة بداء السكري من النوع الثاني بنحو الثلثين على مدى ست سنوات، مقارنةً بمن حققوا هدف الوزن وحده. ما يعنيه هذا بالنسبة لك: هدف الوزن وسيلةٌ، أما القيمة المخبرية التي عادت إلى الطبيعي فهي الهدف الحقيقي.
وأخيراً، أجرت تجربة مجتمعية في ولاية كيرالا بالهند توزيعاً عشوائياً لأكثر من 1,000 امرأة ممن ارتفع لديهن مستوى الجلوكوز الصيامي، بين برنامج نمط حياة منظم لمدة 12 شهراً وبين الرعاية المعتادة. ما توصلت إليه: عادت نحو 46% من مجموعة البرنامج إلى تحمّل الجلوكوز الطبيعي، مقابل نحو 6% من المجموعة الضابطة، مع تحسّن في مستوى الجلوكوز الصيامي والهيموغلوبين السكري A1C والوزن ومحيط الخصر. ما يعنيه هذا بالنسبة لك: تحقّق هذا خارج مطبخ بحثي متخصص، بطعام عادي، وهو أمر مطمئن لكل من لا يستطيع اتباع نظام غذائي مُعدّ بالكامل.
تستحق الدراسات الأربع القراءة مع مراعاة التحفظ ذاته. فلم تختبر أيٌّ منها النظام الغذائي الكيتوني بالطريقة التي اتبعتها تجربة Cell Metabolism الجديدة، ولا تُجيز أيٌّ منها اتباع نظام غذائي ذاتي دون مدخلات طبية.
متى تتحدث إلى طبيب
تحدث إلى طبيب قبل إجراء أي تغيير كبير في نظامك الغذائي إذا انطبق عليك أيٌّ مما يلي: إذا كنت تتناول الأنسولين أو دواءً لخفض الجلوكوز، إذ قد يُسبب تقليل الكربوهيدرات بشكل حاد انخفاضاً في السكر ما لم تُراجَع الجرعات؛ أو إذا كنت تعاني من مرض معروف في الكلى أو الكبد أو القلب؛ أو إذا كنت حاملاً أو مرضعةً؛ أو إذا كان لديك تاريخ مع اضطرابات الأكل؛ أو إذا كنت تتناول أدوية تعتمد جرعتها على النظام الغذائي، كالوارفارين.
احجز موعداً للمراجعة في أقرب وقت، بدلاً من انتظار الفحص الدوري القادم، إذا ظهرت لديك أعراض مثل العطش الشديد غير المعتاد، أو كثرة التبول، أو فقدان الوزن غير المبرر، أو الإرهاق المستمر، أو إذا أشارت نتيجة متكررة إلى دخول نطاق السكري. القيمة الشاذة الواحدة مدعاةٌ لإعادة الفحص، لا تشخيصاً.
مسرد المصطلحات
| شرط | تعريف |
|---|---|
| مقدمات السكري | حالة يكون فيها سكر الدم أعلى من الطبيعي لكن دون بلوغ عتبة السكري. تُحدَّد بالقيم المخبرية لا بالأعراض. |
| الهيموغلوبين السكري (HbA1c) | نسبة الهيموغلوبين الحامل للسكر المرتبط به. تعكس متوسط مستوى سكر الدم على مدى الأشهر الثلاثة السابقة تقريباً. |
| جلوكوز الصيام | قياس سكر الدم بعد صيام لا يقل عن ثماني ساعات. وهو أكثر الفحوصات الأولية شيوعاً للكشف عن مقدمات السكري. |
| MASLD | مرض الكبد الدهني المرتبط بالخلل الأيضي: تراكم الدهون الزائدة في الكبد دون علاقة بالإفراط في تناول الكحول. كان يُعرف سابقاً بـ NAFLD. |
| الحساسية للأنسولين | مدى استجابة أنسجة الجسم للأنسولين. انخفاض الحساسية يعني أن الجسم يحتاج إلى كميات أكبر من الأنسولين لتحقيق نفس التأثير. |
| الجلوكاجون | هرمون تفرزه البنكرياس ويعمل بشكل معاكس تقريبًا للأنسولين، إذ يحفّز الكبد على إطلاق السكر المخزّن وتكسير الدهون المخزّنة. |
| الدهون الحشوية | الدهون المتراكمة في عمق البطن حول الأعضاء الداخلية، في مقابل الدهون الموجودة تحت الجلد. وهي أكثر ارتباطًا بمخاطر الاضطرابات الأيضية. |
| ALT | ناقلة أمين الألانين، وهي إنزيم كبدي. ترتفع مستوياته عادةً عند التهاب خلايا الكبد أو تلفها. |
| تجربة عشوائية مضبوطة | دراسة يُوزَّع فيها المشاركون على مجموعات بشكل عشوائي، مما يقلّل من احتمال أن تعكس الفوارق بين المجموعات اختيارات المشاركين أنفسهم. |
| تراجع مقدمات السكري | عودة قيم الجلوكوز إلى النطاق الطبيعي بعد أن كانت ضمن نطاق مقدمات السكري. يتعامل الباحثون بشكل متزايد مع هذا الهدف باعتباره غاية مستقلة في حد ذاتها. |
الأسئلة الشائعة
هل تعني نتائج هذه الدراسة أن الحمية الكيتونية هي الأفضل لمقدمات السكري؟
لا. تعني أنه في دراسة أُجريت على 42 بالغًا تحت إشراف دقيق وفقدوا الوزن ذاته، أظهر المشاركون في المجموعة الكيتونية انخفاضًا أكبر في دهون الكبد وعودةً أكثر تكرارًا لقيم الجلوكوز إلى الطبيعي خلال أربعة إلى خمسة أشهر. وكانت دراسة صغيرة وقصيرة المدة، وكان الطعام مُقدَّمًا بالكامل للمشاركين. وقد وجدت تجارب أطول أمدًا، من بينها NAFLDiet، أن النظام الغذائي النباتي قليل الدهون أدّى أداءً مماثلًا على الأقل في عدة مقاييس. يبقى أفضل نظام غذائي هو الذي يستطيع الشخص الالتزام به، بالتشاور مع طبيبه.
كم من الوقت يستغرق تغيير النظام الغذائي حتى يظهر أثره في تحاليل الدم؟
يمكن أن يتغير جلوكوز الصيام خلال أيام إلى أسابيع. أما الهيموغلوبين السكري A1C فيتأخر لأنه يعكس متوسط مستوى السكر في الدم على مدى ثلاثة أشهر تقريبًا، لذا يستلزم التغيير الملحوظ عادةً ثمانية إلى اثني عشر أسبوعًا. وتتفاوت مؤشرات الكبد؛ فقد انخفضت دهون الكبد بشكل ملحوظ خلال أربعة إلى خمسة أشهر في هذه الدراسة، غير أن ذلك قِيس بالتصوير الطبي لا بفحوصات الدم الروتينية.
هل يمكن لمقدمات السكري أن تختفي فعلًا؟
يمكن أن تعود قيم الجلوكوز إلى النطاق الطبيعي، ويصف الباحثون هذا الآن بـ"تراجع مقدمات السكري". غير أن ذلك لا يُعدّ ضمانًا. تشير الأبحاث المنشورة إلى أن الأشخاص الذين يصلون إلى القيم الطبيعية يحتفظون بمخاطر أقل بكثير للإصابة بداء السكري من النوع الثاني لسنوات لاحقة، شريطة الحفاظ على التغييرات الجوهرية التي أحدثوها.
هل النظام الغذائي الغني بالدهون آمن على مستوى الكوليسترول؟
في هذه التجربة بالذات، لم تُظهر المجموعة التي اتبعت النظام الكيتوني أي ارتفاع في دهون الدم أو الكوليسترول رغم تناولها أعلى كمية من الدهون، وهو ما فاجأ الباحثين. جاءت هذه النتيجة من دراسة صغيرة خاضعة لرقابة دقيقة أُجريت على أشخاص كانوا في مرحلة فقدان الوزن بشكل فعلي، ولا يمكن تعميمها. وينبغي لكل من يعاني من اضطراب في الدهون، أو لديه تاريخ عائلي لأمراض القلب المبكرة، أو يتلقى علاجاً للكوليسترول، أن يُجري فحص لوحة الدهون قبل أي تغيير غذائي جوهري وبعده.
هل أحتاج إلى فحص تصويري لمعرفة ما إذا كنت أعاني من الكبد الدهني؟
يُقاس مقدار الدهون في الكبد بالفحوصات التصويرية، لا بتحليل الدم الاعتيادي. غير أن تحاليل الدم تُقدّم مؤشرات مفيدة، كإنزيمات الكبد والجلوكوز والدهون الثلاثية والمؤشرات غير الغازية المحسوبة من القيم الروتينية. ويقرر الطبيب ما إذا كان الفحص التصويري أو تقييم التليف ضرورياً.
نسبة الهيموغلوبين السكري (A1C) لديّ 5.8%. هل يجب أن أقلق؟
تقع هذه النسبة ضمن نطاق مقدمات السكري، وهي إشارة تستدعي الانتباه لا حالة طارئة. تتمثل الخطوات المعتادة التالية في التحقق من القيمة، والنظر في مستوى سكر الدم الصيامي إلى جانبها، ومراجعة العوامل القابلة للتعديل. كثير من الأشخاص الذين تقع نسبتهم في هذا النطاق لا يتطورون إلى مرض السكري، لا سيما حين تدفعهم النتيجة إلى إجراء تغيير في نمط حياتهم.
مصادر
- مراكز السيطرة على الأمراض والوقاية منها — فحص A1C للسكري ومقدماته، 2024 — cdc.gov
- المعهد الوطني للسكري وأمراض الجهاز الهضمي والكلى (NIH) — التغذية والنظام الغذائي لمرض الكبد الدهني غير الكحولي (NAFLD) والتهاب الكبد الدهني غير الكحولي (NASH)، 2021 — niddk.nih.gov
- Mayo Clinic — مقدمات السكري: التشخيص والعلاج، 2023 — mayoclinic.org
- Petersen MC, Smith GI, Farabi SS, Palacios HH, Shankaran M, Hellerstein MK, Patterson BW, Klein S — تأثير محتوى المغذيات الكبرى في النظام الغذائي على الاستجابة القلبية الأيضية لفقدان الوزن: تجربة سريرية عشوائية — Cell Metabolism، 2026 — doi.org/10.1016/j.cmet.2026.07.020
- Fridén M, Rosqvist F, Kullberg J, et al. — تأثيرات نظام غذائي منخفض الكربوهيدرات مرتفع الدهون المتعددة غير المشبعة المضاد لتكوين الدهون، أو نظام غذائي نوردي صحي، مقارنةً بالرعاية المعتادة على دهون الكبد والاضطرابات القلبية الأيضية في مرض السكري من النوع الثاني أو مقدماته: تجربة عشوائية مضبوطة (NAFLDiet) — Nature Communications، 2025 — doi.org/10.1038/s41467-025-65613-2 (مُسترجَع عبر PubMed)
- Sandforth A, et al. — آليات مغفرة مقدمات السكري الناجمة عن فقدان الوزن: تحليل لاحق لدراسة PLIS العشوائية المضبوطة متعددة المراكز — The Lancet Diabetes and Endocrinology، 2023 — consensus.app
- Jumpertz von Schwartzenberg R, et al. — دور مغفرة مقدمات السكري الناجمة عن فقدان الوزن في الوقاية من السكري من النوع الثاني: حان الوقت لتحسين الوقاية من السكري — Diabetologia، 2024 — consensus.app
- Mathews E, et al. — فعالية تعديل نمط الحياة في تراجع مقدمات السكري لدى النساء المصابات بارتفاع سكر الصيام المعزول: تجربة عشوائية مضبوطة مجتمعية في الهند — أبحاث السكري والممارسة السريرية، 2026 — consensus.app
للمزيد من القراءة
- مقاومة الأنسولين دون سمنة: ما تكشفه تحاليل الدم
- فحوصات الدم لمرض السكري: الجلوكوز، والهيموغلوبين السكري HbA1c، والأنسولين
- تحليل الدهون: الكوليسترول، LDL، HDL والدهون الثلاثية
- كيف تخفض مستوى ALT: 8 خطوات لحماية الكبد
- ارتفاع الكوليسترول: الأعراض والأسباب والأرقام والعلاج
افهم نتائج مختبرك باستخدام AI DiagMe
نادرًا ما يأتي تقرير مقدمات السكري مصحوبًا بشرح وافٍ. غير أن القيم التي تحدد ما إذا كنت فوق العتبة أو دونها — سكر الصيام، وA1C، وإنزيمات الكبد، والدهون الثلاثية — مطبوعة جميعها في الصفحة ذاتها، ولا تكتمل صورتها إلا بقراءتها معًا. يحوّل AI DiagMe تلك الصفحة إلى لغة واضحة ومبسّطة، مؤشرًا بمؤشر، حتى تصل إلى موعدك القادم وأنت تعرف تمامًا الأسئلة التي ينبغي طرحها. يساعدك على فهم نتائجك؛ لكنه لا يشخّص، ولا يُغني عن طبيبك.
احصل على تفسير نتائجك في دقائق