




































Esta tabla de conversión de A1C transforma tu porcentaje de A1C en un valor de glucosa promedio estimada (eAG) en las mismas unidades que usa tu glucómetro: mg/dL y mmol/L. Si tu resultado de laboratorio muestra un A1C pero tú piensas en términos de niveles de azúcar en sangre del día a día, la tabla, la fórmula y los ejemplos que encontrarás a continuación te permiten pasar de uno a otro en segundos. En este artículo encontrarás la tabla completa de A1C a eAG, la fórmula exacta, ejemplos que responden las preguntas más frecuentes y por qué tu A1C puede diferir del promedio que muestra tu glucómetro o sensor.
Tabla de conversión de A1C a eAG
La glucosa promedio estimada (eAG) expresa tu A1C como un nivel promedio de azúcar en sangre. Los valores de la tabla se obtienen con la fórmula estándar de la Asociación Americana de Diabetes y coinciden con las cifras que publican los principales centros médicos.
| A1C (%) | eAG (mg/dL) | eAG (mmol/L) |
|---|---|---|
| 5 | 97 | 5.4 |
| 5.7 | 117 | 6.5 |
| 6 | 126 | 7.0 |
| 6.5 | 140 | 7.8 |
| 7 | 154 | 8.6 |
| 7.5 | 169 | 9.4 |
| 8 | 183 | 10.2 |
| 8.5 | 197 | 10.9 |
| 9 | 212 | 11.8 |
| 10 | 240 | 13.4 |
| 11 | 269 | 14.9 |
| 12 | 298 | 16.5 |
La fórmula detrás de la conversión
Si tu A1C exacto no aparece en la tabla, la fórmula te da cualquier valor. La glucosa promedio estimada en mg/dL es igual a 28.7 multiplicado por tu A1C, menos 46.7:
eAG (mg/dL) = 28.7 × A1C − 46.7
Para hacer el cálculo al revés, es decir, pasar de una glucosa promedio a un A1C, solo reorganiza la fórmula: A1C (%) = (eAG + 46.7) ÷ 28.7. Para convertir entre unidades, divide mg/dL entre 18 para obtener mmol/L. Estos son los mismos cálculos que realiza cualquier calculadora de A1C en línea, así que puedes verificar cualquier número tú mismo.
Ejemplos prácticos
Estos ejemplos responden las preguntas que la gente hace con más frecuencia:
- Un A1C de 5.8% equivale a aproximadamente 120 mg/dL (6.7 mmol/L).
- Una glucosa promedio de 100 mg/dL corresponde a un A1C de aproximadamente 5.1%.
- Una glucosa promedio de 120 mg/dL corresponde a un A1C de aproximadamente 5.8%.
- Una glucosa promedio de 140 mg/dL corresponde a un A1C de aproximadamente 6.5%, el umbral que se usa para diagnosticar diabetes.
- Un A1C de 7%, meta común para muchos adultos con diabetes, equivale a una eAG de 154 mg/dL (8.6 mmol/L).
Qué significa la eAG y qué no significa
La glucosa promedio estimada es un promedio a largo plazo de aproximadamente dos a tres meses, no una medición instantánea. Por eso tu eAG rara vez coincidirá con alguna lectura individual de tu glucómetro: un valor en ayunas por la mañana o un pico después de comer refleja un momento específico, mientras que el eAG combina miles de momentos. Piensa en el eAG como el promedio de toda una temporada y en una punción digital como un turno al bate. Ambos son útiles y responden preguntas distintas. Para una explicación más completa de lo que mide la prueba subyacente, consulta nuestra guía completa de hemoglobina glucosilada.
Referencia rápida de los rangos de A1C
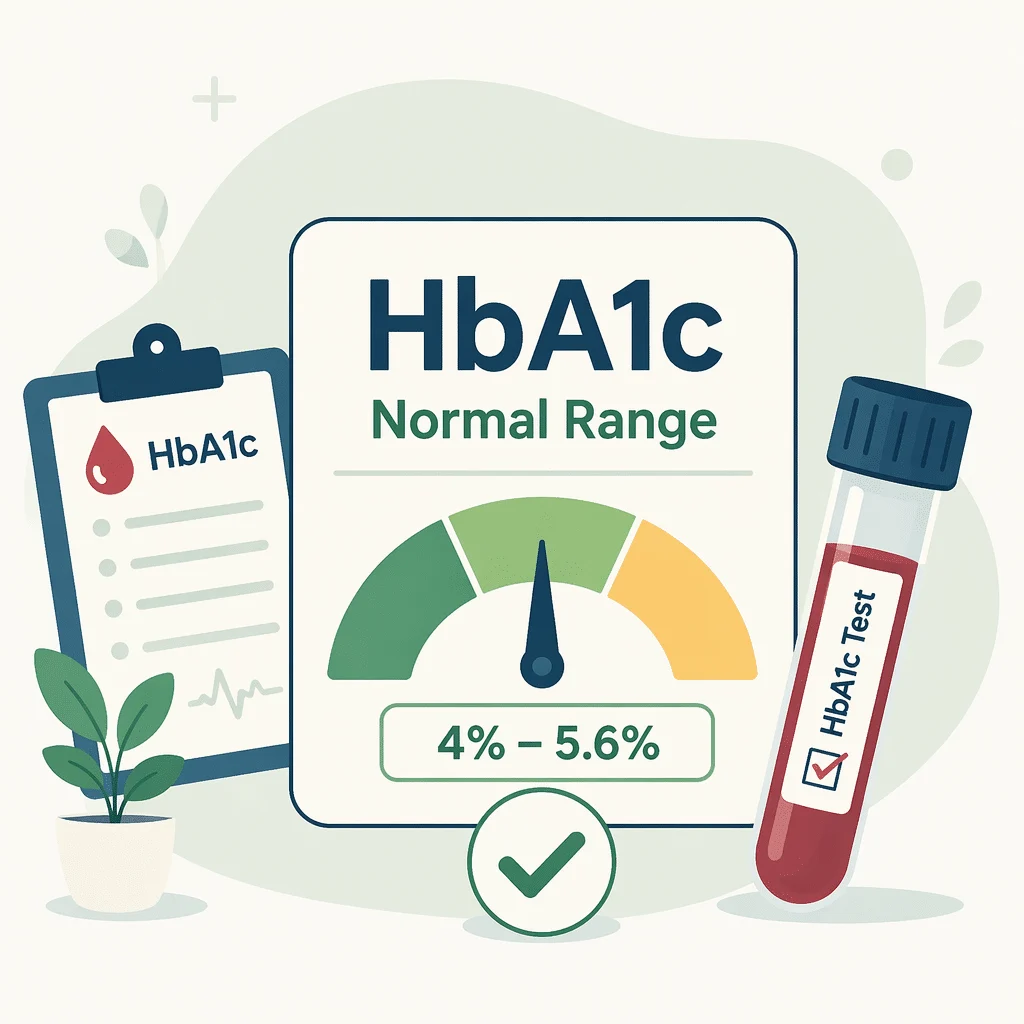
La conversión es más útil cuando también sabes en qué nivel está tu A1C. Estas categorías diagnósticas aplican a la mayoría de los adultos que no están embarazados, pero las metas individuales varían, así que confirma la tuya con tu médico.
| A1C (%) | Categoría | eAG aprox. (mg/dL) |
|---|---|---|
| Menor de 5.7 | Normal | Menos de 117 |
| 5.7–6.4 | Prediabetes | 117–137 |
| 6.5 o más | Diabetes | 140 o más |
Para ver el panorama completo sobre metas, repetición de la prueba y qué puede subir o bajar el valor, lee la guía de HbA1c, o compáralo con un glucosa en ayuno.
Por qué tu A1C y el promedio de tu glucómetro o sensor pueden no coincidir
El eAG calculado a partir de tu A1C es una estimación y no siempre coincidirá con el promedio que reporta tu monitor continuo de glucosa (MCG). El valor del MCG tiene su propio nombre: indicador de manejo de glucosa (GMI, por sus siglas en inglés), y estudios recientes muestran que ambos suelen diferir.
Un estudio en personas reales que usan MCG encontró que solo alrededor de 1 de cada 10 tenía una coincidencia cercana entre su A1C de laboratorio y la estimación basada en el sensor; la mitad difería en medio punto porcentual o más. En términos cotidianos, tu A1C podría marcar 7.0% mientras que tu sensor sugiere algo notablemente más alto o más bajo. Un estudio de seguimiento mostró que esta diferencia es aún mayor en personas con enfermedad renal crónica, donde la renovación de glóbulos rojos está alterada. Una revisión de 2025 reunió todos estos hallazgos en una lista práctica de las causas del desajuste, desde la calibración del sensor hasta condiciones que cambian la vida útil de los glóbulos rojos. Lo que esto significa para ti es sencillo: si tu A1C y tus valores diarios parecen contar historias distintas, eso es común y vale la pena comentarlo con tu médico en lugar de asumir que algún dispositivo está fallando. Estos son hallazgos de investigación que siguen refinándose, pero la conclusión es consistente.
Ciertas condiciones también hacen que el A1C sea menos confiable, como la anemia, la pérdida de sangre reciente o una transfusión, el embarazo y las variantes hereditarias de hemoglobina que son más comunes en personas de ascendencia africana, mediterránea o del sudeste asiático. En esas situaciones, el médico puede apoyarse más en mediciones directas de glucosa o en un marcador a corto plazo, como Fructosamina.
Glosario
- A1C: un análisis de sangre que reporta el porcentaje de hemoglobina recubierta de glucosa, lo que refleja aproximadamente 2 a 3 meses de niveles de azúcar en sangre.
- Glucosa promedio estimada (eAG, por sus siglas en inglés): tu A1C expresado como un nivel promedio de azúcar en sangre en mg/dL o mmol/L.
- Indicador de manejo de glucosa (GMI, por sus siglas en inglés): la glucosa promedio estimada a partir de los datos de un monitor continuo de glucosa.
- mg/dL: miligramos por decilitro, la unidad de glucosa utilizada en Estados Unidos.
- mmol/L: milimoles por litro, la unidad de glucosa utilizada en gran parte del mundo.
- mmol/mol: la unidad que algunos laboratorios usan para reportar el A1C, junto con el porcentaje.
- Variante de hemoglobina: una forma hereditaria de hemoglobina que puede hacer que los resultados del A1C sean menos precisos.
Preguntas frecuentes
¿Cuál es mi A1C si mi azúcar en sangre promedio es 140 mg/dL? Aproximadamente 6.5%, usando la fórmula A1C = (140 + 46.7) ÷ 28.7. Ese valor también coincide con el punto de corte para diagnosticar diabetes.
¿Qué glucosa promedio corresponde a un A1C de 6.5%? Aproximadamente 140 mg/dL (7.8 mmol/L), que marca el límite entre prediabetes y diabetes.
¿La eAG es igual al promedio de mi glucómetro? No exactamente. La eAG es una estimación a largo plazo basada en tu A1C, mientras que el promedio de tu glucómetro o monitor continuo cubre un período más corto y reciente, por lo que ambos pueden diferir.
¿Cómo convierto el A1C a mmol/mol? Esa es una conversión diferente a la de la eAG. Algunos laboratorios reportan el A1C en mmol/mol; como referencia aproximada, 6.5% equivale a unos 48 mmol/mol y 7% a unos 53 mmol/mol.
¿Puedo confiar en una calculadora de A1C en línea? Sí, siempre que use la fórmula estándar que se muestra arriba. La tabla de esta página arroja los mismos resultados, así que puedes verificar cualquier herramienta.
¿Por qué mi A1C parece alto si mis lecturas diarias se ven bien? Los niveles de glucosa durante la noche y después de las comidas que no mides pueden elevar el promedio, y algunas condiciones distorsionan el A1C. Si la diferencia es grande, pídele a tu médico que revise ambos juntos.
Lecturas recomendadas
- Hemoglobina glucosilada (HbA1c): la guía completa
- Glucosa en ayunas: qué significa y cómo interpretarla
- Niveles de glucosa en sangre: causas y significado
- Fructosamina: un marcador de azúcar a corto plazo
- Diabetes: causas, síntomas y tratamiento
Fuentes
- Instituto Nacional de Diabetes y Enfermedades Digestivas y Renales (NIDDK, NIH). La prueba de A1C y la diabetes. https://www.niddk.nih.gov/health-information/diagnostic-tests/a1c-test
- Asociación Americana de Diabetes. Cómo entender el A1C y la conversión a eAG. https://diabetes.org/about-diabetes/a1c
- Mayo Clinic. Prueba de A1C. https://www.mayoclinic.org/tests-procedures/a1c-test/about/pac-20384643
- Perlman JE, et al. HbA1c and Glucose Management Indicator Discordance: A Real-World Analysis. Diabetes Technol Ther, 2020. https://consensus.app/papers/details/09f59b200c6f5fc8985bea7730c1bdcf/
- Oriot P, et al. Discordance Between HbA1c and the Glucose Management Indicator in Diabetes and Chronic Kidney Disease. J Diabetes Sci Technol, 2022. https://consensus.app/papers/details/4edfb9f0f7d7585bbbd7ecd0ce5dd517/
- Lenters-Westra E, et al. Managing discordance between HbA1c and glucose management indicator. Diabetic Medicine, 2025. https://consensus.app/papers/details/cf3149da66a6524d8404938698139ed1/
Entiende tus resultados de laboratorio con AI DiagMe
Convertir tu A1C es el primer paso; entenderla junto con tu glucosa en ayunas y otros marcadores es el siguiente. AI DiagMe lee el reporte de laboratorio que subas y te explica en un lenguaje sencillo qué pueden significar para ti tu A1C, el promedio estimado de glucosa y los demás valores, para que puedas preparar preguntas útiles para tu médico. Te ayuda a entender tus resultados; no diagnostica enfermedades ni reemplaza a tu doctor.
Obtén la lectura de tus resultados en minutos