


Understanding your biological vs chronological age can tell you more about your health than your birthday alone. Your chronological age simply counts the years since you were born, while your biological age reflects how worn your cells, blood vessels, and organs actually are. Two people born the same year can be aging at very different speeds. In this article you’ll learn what each term means, how scientists estimate biological age, which blood markers are tied to faster aging, and what recent clinical trials show about slowing the process, all explained in plain language and without hype.
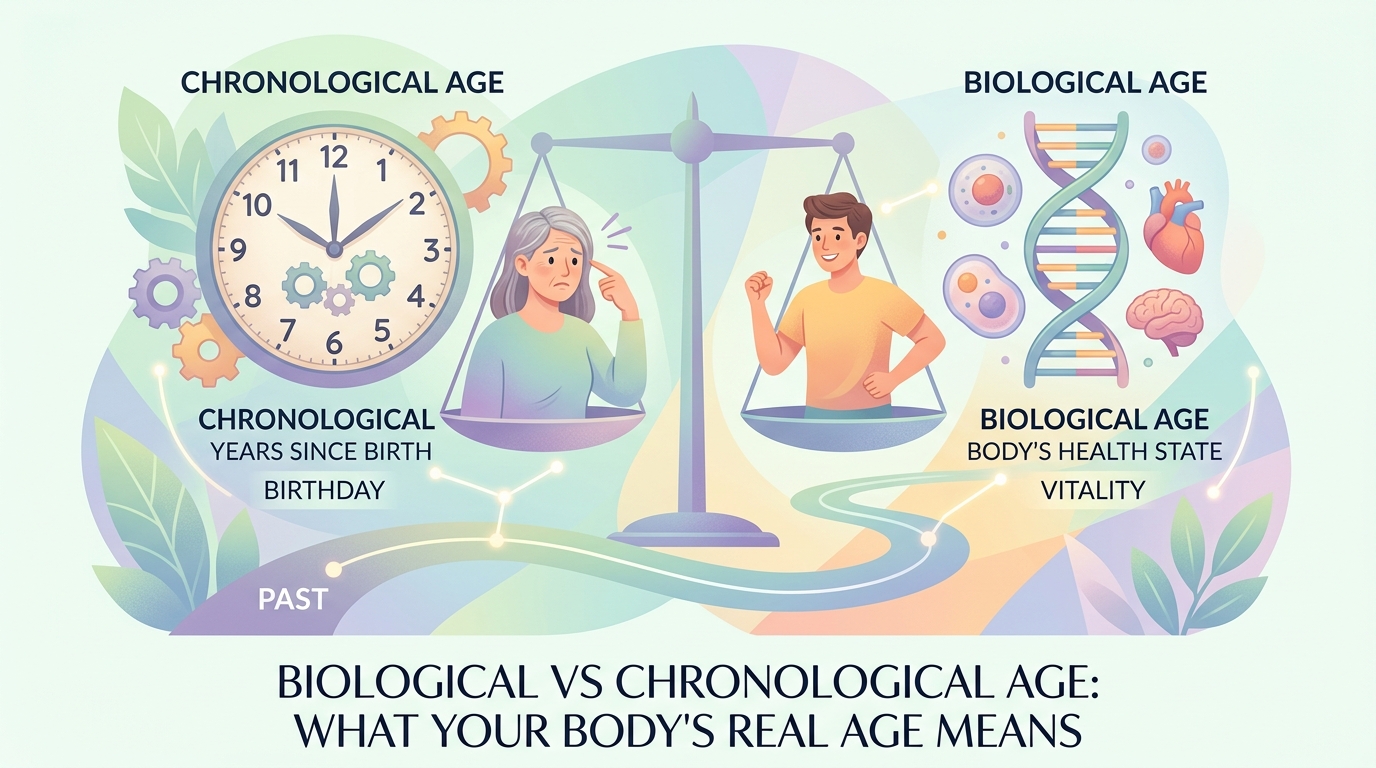
Biological vs chronological age: the key difference
Your chronological age is easy: it is the number of years since you were born, and it rises by one year every year for everyone. Biological age is different. It tries to describe the real condition of your cells, tissues, and organs at a given moment.
That distinction matters because bodies do not age at the same rate. At 50, one person may have a biological age of 44 and another a biological age of 58. These gaps reflect the buildup of cellular damage over time, shaped by genes, daily habits, and environment.
| Feature | Chronological age | Biological age |
|---|---|---|
| Definition | Years since birth | How worn your cells and organs actually are |
| How it’s obtained | Date of birth | Biological markers (DNA methylation, blood tests, telomeres) |
| How it changes | Fixed: +1 year per year | Variable: can speed up or slow down |
| Can you change it? | No | Partly, through lifestyle |
| Health value | Administrative number | Possible reflection of age-related disease risk |
For health purposes, biological age is often seen as a more meaningful signal than your actual age, because it tracks more closely with your individual risk of chronic disease. But it is also a more complex and less settled measure, as the rest of this guide explains.
What biological age actually measures
Aging is not a single clock ticking somewhere in the body. It is the sum of many processes that build up over time: DNA picks up chemical changes, cells renew themselves less efficiently, low-grade inflammation rises, and repair systems slow down.
Scientists describe these changes with biomarkers of aging: measurable values meant to reflect this wear and tear. Biological age is an attempt to summarize several of these signals into one number, expressed in years, which is easier to grasp than a long list of measurements.
One key point to keep in mind: biological age is a statistical estimate. It describes an average trend seen across large groups of people, not a precise verdict about one individual. Two labs, or two methods, can return different numbers for the same person.
How scientists estimate biological age
Several approaches exist, with very different levels of reliability. None of them is a routine medical test today, and most are used mainly in research or sold directly to consumers.
Epigenetic clocks (DNA methylation)
This is the most studied method. Epigenetics refers to chemical marks that sit on DNA and control how genes are switched on or off, without changing the underlying sequence. The most important is DNA methylation, the addition of small chemical groups at specific spots in the genome. Because these marks shift with age, algorithms called epigenetic clocks estimate an epigenetic age from their pattern. Recent clocks go by names such as PhenoAge, GrimAge, and DunedinPACE.
Blood-based age scores
Other models estimate biological age by combining common blood results, such as glucose, inflammation markers, kidney function, and albumin. The PhenoAge score, for example, relies on a handful of standard tests. These approaches have the advantage of using data you may already have after a routine blood draw, which is why it helps to know how to read your blood test results.
Telomere length
Telomeres are the protective caps on the ends of your chromosomes, and they shorten each time a cell divides. Their length was long promoted as an aging marker, but the measurement is imprecise and poorly reproducible from one test to another.
Direct-to-consumer tests
Many online services offer to estimate your biological age from a saliva or blood kit, and sometimes from a simple questionnaire or a selfie. Their scientific value varies and is often limited, so results should be read with real caution. For a deeper look at how testing and interpretation work in practice, see our guide to biological age blood testing.
| Method | What it measures | Availability | Main limitations |
|---|---|---|---|
| Epigenetic clock | Age-related chemical marks on DNA | Mostly research; paid at-home kits | Results vary by clock used |
| Blood-based score (e.g., PhenoAge) | A combination of routine lab tests | Can be calculated from a blood draw | Validated in populations, not for individual diagnosis |
| Telomere length | Wear on the ends of chromosomes | Specialized tests | Imprecise, low reproducibility |
| Quizzes or “selfie” tools | Appearance or self-reported habits | Consumer apps | Rough estimate, limited scientific value |
The blood markers linked to faster aging
You will not see a “biological age” line on a standard blood test. But several results you may already know reflect mechanisms tied to aging. Tracking them, and especially having a clinician interpret them, gives a concrete picture of your health.
Among the most informative are HbA1c and fasting glucose, which show how your body handles sugar. Persistently high blood sugar speeds up several aging processes, so the HbA1c normal range is worth understanding.
Blood fats matter too. A lipid panel measures cholesterol and triglycerides, which feed into cardiovascular risk, one of the major families of age-related disease. Chronic, low-grade inflammation is another thread, often followed with C-reactive protein (CRP).
Kidney function, tracked through a kidney function panel and the eGFR, declines naturally with age, and a faster-than-average drop deserves attention. Homocysteine, an amino acid linked to heart and brain health, and vitamin D both come up repeatedly in aging research, as the next section shows.
To see these values together, a full blood panel is the most useful starting point, and a chart of normal blood test ranges helps you read them. No single marker defines your biological age. It is the overall pattern, placed in the context of your personal history, that means something.
Can you lower your biological age?
Partly, yes, and that is what makes the topic interesting. Unlike your actual age, biological age appears to be partly modifiable. The levers are not dramatic, but they line up with what is already recommended for health in general.
The factors most consistently linked to slower aging are regular physical activity, a Mediterranean-style diet, enough good-quality sleep, not smoking, moderate alcohol intake, and managing chronic stress. On the other side, smoking, obesity, and prolonged inflammation tend to accelerate several aging markers.
A word of caution is in order. Many reported effects are modest and measured over a few years. The very precise claims you sometimes see online, such as “reverse your age by 10 years,” go well beyond what serious studies show. The realistic goal is to slow a trend, not to turn back the clock.
Latest scientific advances
Recent peer-reviewed research helps separate what is demonstrated from what is marketing. According to studies indexed in PubMed, here is what has taken shape over the past few years.
A randomized controlled trial (a study that assigns participants at random, the highest level of everyday clinical evidence) from the DO-HEALTH project tested vitamin D, omega-3, and a home exercise program in 777 adults over age 70, looking at four epigenetic clocks over three years. Omega-3 alone slightly slowed several clocks, and combining all three measures showed an additive benefit on one of them. The effects were small, on the order of a few months over three years (Bischoff-Ferrari et al., Nature Aging, 2025 — DOI).
Another large randomized trial, VITAL, looked at telomeres in more than 1,000 participants. Vitamin D reduced telomere shortening over four years, while omega-3 had no significant effect on that particular marker (Zhu, Manson et al., American Journal of Clinical Nutrition, 2025 — DOI).
Together, these trials make a key point: depending on the marker chosen, the same substance does not give the same result. Biological age is not a single fixed measure but a family of indicators that do not always agree with one another.
On the review side, a major paper in Cell describes the rise of precision longevity medicine, in which biomarkers of aging could one day guide personalized prevention, pending future clinical trials and regulatory approval (Kroemer et al., 2025 — DOI). At the same time, a consensus effort stresses that the clinical use of these markers is still limited and that they need further validation to be reliable at the individual level (Moqri et al., Nature Aging, 2024 — DOI). A methodological review adds that epigenetic clocks, while promising, still raise real interpretation challenges (Teschendorff and Horvath, Nature Reviews Genetics, 2025 — DOI).
The takeaway: research is moving fast, but a recent finding is not the same as a settled consensus. None of these studies turns biological age into a diagnostic tool, and none justifies changing your medical care on your own.
Should you take a biological age test? When to talk to a doctor
For most people, a biological age test bought online does not add information that would actually change their care. These tests are not yet part of routine medicine, and an alarming result can create needless stress or push someone toward rushed decisions, such as unproven supplements or extreme diets.
A more useful path is to track the standard markers in a regular checkup with your clinician, because those are validated and actionable. Some signals are worth a medical visit regardless of any biological age score:
- unusual fatigue, unexplained weight loss, or persistent symptoms;
- a strong family history of heart disease, diabetes, or certain cancers;
- lab results that are repeatedly outside the reference ranges;
- new symptoms after a change in lifestyle or medication.
In every case, the final interpretation of a result belongs to a clinician, who places the numbers in your overall context. Conditions such as high blood pressure and Alzheimer’s disease become more common with age, which is one reason biological aging draws so much interest.
Glossary
| Term | Definition |
|---|---|
| Chronological age | The number of years since you were born; it rises at a fixed rate. |
| Epigenetic age | An age estimated by an epigenetic clock from chemical marks on your DNA. |
| Epigenetic clock | An algorithm that predicts biological age from DNA methylation patterns. |
| DNA methylation | The addition of chemical groups to DNA that changes gene activity without changing the sequence. |
| Telomeres | Protective caps on the ends of chromosomes that shorten as cells divide. |
| Cellular senescence | A state in which a cell stops dividing but stays active, contributing to aging. |
| DunedinPACE | A recent epigenetic clock that estimates the pace of aging rather than a fixed age. |
| Randomized controlled trial | A study that assigns participants to groups at random, giving a high level of evidence. |
Frequently asked questions
What is a normal gap between biological and chronological age?
There is no official threshold, because it depends on the method used. In studies, biological age sits around chronological age, with gaps of a few years in either direction. A gap of five to ten years is regularly described in people with very different lifestyles. What matters most is not the exact number from a single test, but the overall trend of your health, followed over time and confirmed with validated markers and your clinician.
Are at-home biological age tests accurate?
Their accuracy is uneven. The epigenetic clocks used in research are serious tools, but once turned into consumer kits, results can vary from one test to another and are hard to interpret for an individual. These tests are not part of routine care. They can be interesting, but a result should never lead, on its own, to a change in treatment or an extreme diet. When in doubt, discuss it with a health professional.
Does biological age appear on a standard blood test?
No. A standard blood test does not report a biological age. However, several of its results, such as glucose, HbA1c, the lipid panel, and kidney function, reflect mechanisms tied to aging. It is their overall pattern, interpreted by a clinician, that tells you about your health. Scores such as PhenoAge are actually calculated from these kinds of routine tests.
Can supplements really lower your biological age?
The evidence is limited and the effects are modest. Recent trials suggest that vitamin D or omega-3 may slow some aging markers, but not all, and the benefits seen are measured in a few months over several years. No supplement is currently proven to make you younger. Maintaining a healthy vitamin D level is still recommended for general health, ideally after checking your level and talking with a clinician.
At what age should you start paying attention to biological age?
The habits that influence aging matter at any age, and the earlier you adopt them, the better. That does not mean you need a biological age test. For most adults, the most useful step is a regular checkup suited to your age and risk factors, rather than a score bought online. The value of screening rises with age and with a family history of disease.
Is a higher biological age a reason to worry?
There is no need to panic: a single number, especially from a consumer test, is not enough to draw conclusions. A biological age above your actual age mostly suggests it may be worth reviewing some habits and discussing them with a clinician. Many factors are modifiable. A reassuring result, on the other hand, does not replace regular medical follow-up. The key is to act on what is proven: activity, diet, sleep, not smoking, and tracking validated markers.
Sources
- National Institute on Aging – Age estimated by changes to DNA can help predict health outcomes
- Cleveland Clinic – Biological Age: What It Is and How You Can Measure It
- NBC News – What’s your biological age? Experts explain the benefits and risks of at-home tests
- PubMed studies cited: Bischoff-Ferrari et al., Nature Aging 2025 (DOI); Zhu, Manson et al., Am J Clin Nutr 2025 (DOI); Kroemer et al., Cell 2025 (DOI); Moqri et al., Nature Aging 2024 (DOI); Teschendorff and Horvath, Nature Reviews Genetics 2025 (DOI).
Further reading
- How to read your blood test results: a simple guide
- Full blood panel: what’s included and why
- Biological age blood testing: a practical guide
- Lipid panel explained: cholesterol, LDL, and HDL
- Kidney function panel: how to read it
Understand your lab results with AI DiagMe
Your biological age does not appear on a lab report, but your results already say a lot about how your body is aging. AI DiagMe helps you understand your blood test results, such as HbA1c, the lipid panel, kidney function, C-reactive protein, and vitamin D, in plain language. The tool does not diagnose and does not replace your doctor; it helps you walk into your appointment better informed. To make sense of your results, try AI DiagMe.
➡️ Get your results interpreted in minutes
