


























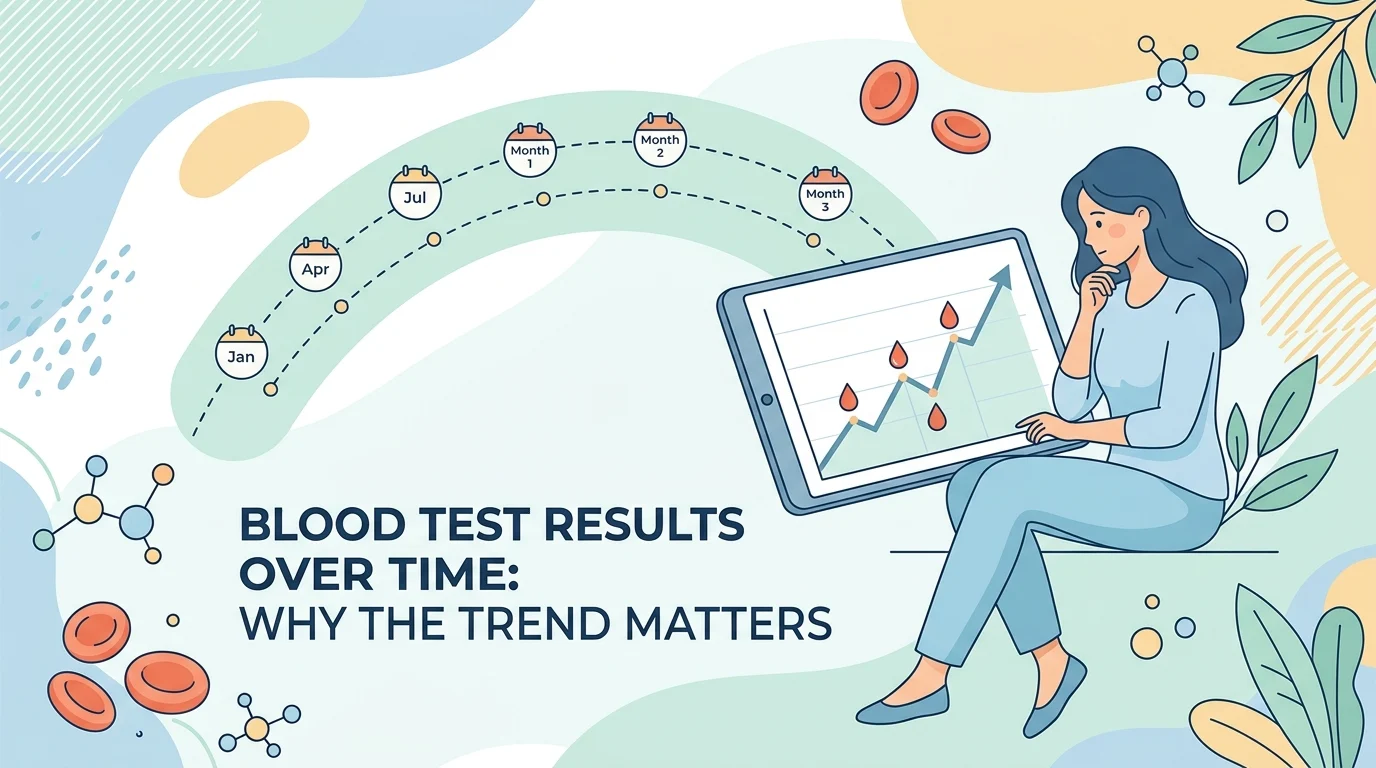
On September 17, 2026, a research team at the University of Oxford published a study in PLOS Medicine that asks a question most patients never think to ask. Not “is my result normal?”, but “has my result moved?”. Working with anonymised primary care records from more than 275,000 adults, the researchers compared two ways of reading the same blood test: the familiar one, which checks whether a value sits inside the reference range, and a second one, which looks at how that value has drifted across earlier tests. The conclusion is quietly practical. For some tests, the direction of travel carries information that a single snapshot misses.
What the Oxford team actually measured
The study followed adults who consulted their family doctor for unexpected weight loss, a symptom that points nowhere in particular and is notoriously hard to triage. About 5 in 100 of them were diagnosed with a cancer within the following six months. The team pulled every available result for 26 routine blood tests recorded before that consultation, then asked a simple question: which way of reading those results better separates the people who turned out to have cancer from the people who did not?
Two answers came out. The first is that adjusting a result for age and sex improves it substantially. A platelet count of a given value does not carry the same meaning in a woman of 35 and a man of 72, and treating it as though it does throws away information the laboratory already has. The second is that once that adjustment is made, the trend across earlier tests adds further discrimination for certain test-and-cancer combinations, though not for all of them.
Why a result inside the reference range can still be worth a second look
A reference range is built from the results of large groups of healthy people, which is exactly why “normal” is a slippery word. The National Library of Medicine makes the point plainly in its guidance for patients: a result inside the range is not a guarantee of good health, and a result outside it is not automatically a problem.
A trend works on a different principle. It compares you with your own earlier self rather than with a population average. A haemoglobin value that has slid from the upper part of the range toward the lower part over three years never triggers an out-of-range flag, yet it has moved, and the movement belongs to you alone. That is the signal the Oxford analysis was trying to recover. Our library also covers 비정상 혈액 검사 결과.
| Reading the single result | Reading the trend |
|---|---|
| Compares you with a reference population | Compares you with your own earlier results |
| Needs only one test | Needs at least two tests, ideally more |
| Flags values that cross a threshold | Can flag movement that never crosses a threshold |
| Unaffected by which laboratory ran the test | Best interpreted when the same laboratory ran every test |
Which tests carried the most signal
The improvement was not uniform. It showed up for particular pairings of a test and a cancer site rather than across the board, which is an important nuance. The pairings the authors highlighted include mean cell volume for bowel cancer and lymphoma, white blood count and neutrophils for lung cancer, and aspartate aminotransferase, red blood cell count, haematocrit and the platelet-to-lymphocyte ratio for prostate cancer.
What unites that list is ordinariness. These are not exotic assays. They are the components of the standard panels a general practitioner orders every day, and most of them sit in the blood count. Another article explains 전혈구 검사(CBC).
최신 과학적 발전
This study did not arrive from nowhere. It belongs to a body of work, mostly British, that has spent several years asking whether the routine tests already sitting in medical records could be squeezed for more early warning.
A companion project known as BLOODTRACC, published in BMC Cancer in 2026 by an overlapping Oxford team, tested the same idea specifically for bowel cancer. It built risk models from trends in haemoglobin, mean cell volume and platelets across the five years before a current test, then validated them in a population of more than six million adults. The models performed respectably, and the researchers noticed something useful for everyday practice: the predictive value improved as the window of past results lengthened, up to roughly three years, and then tailed off. In plain terms, tests from the last two or three years are the ones that carry the signal. A result from a decade ago adds little.
A separate analysis published in The BMJ in 2024, covering 326,240 adults with unexpected weight loss, examined which abnormal results actually raised the probability of cancer. Low albumin, raised platelets, a raised total white cell count and raised C-reactive protein all did. But the authors closed on a line worth remembering: no normal blood test result, taken on its own, ruled cancer out. That is the same caution the trend research approaches from the other direction.
Finally, a scoping review in BJGP Open, drawing on 25 studies and more than 916,000 patients, looked at what doctors are actually advised to do when someone loses weight without explanation. Most guidance converges on the same unglamorous starting point: repeat weight measurements over time, a family history, a proper examination, and a small set of common tests including C-reactive protein, a full blood count, alkaline phosphatase and thyroid-stimulating hormone.
What this does not mean
It would be easy to read all of this as an argument for testing yourself more often, and it is not. Every one of these studies was conducted in people who had already gone to a doctor with a symptom. None of them tested the idea of tracking your own blood counts in the absence of any complaint, and none of them measured whether doing so improves anything.
The research is also observational. It describes patterns found in records collected for other purposes, which is a legitimate way to generate a hypothesis but not the same as proving that acting on the pattern helps patients. The Oxford authors are candid about the limits: their analysis could only include people who happened to have two or more tests in a given window, and the reasons a doctor orders a test in the first place are themselves a source of bias. Nobody is proposing that trends replace clinical judgement or established screening programmes.
병원을 방문해야 할 때
The practical takeaway is narrower and more useful than “watch your bloods”. Unexplained weight loss is the symptom that ran through every study here, and it is the one worth acting on. Losing weight without trying, particularly alongside persistent fatigue, a change in bowel habit, or any bleeding you cannot account for, is a reason to book an appointment rather than wait for the next routine check.
If you do go, bring your old results. Most people keep only the latest report, yet the last two or three years of tests are precisely what this research suggests a clinician can use. Sticking with the same laboratory helps too, since methods and reference ranges differ between them and that variation can masquerade as a trend. A companion guide details 혈액 검사 결과 읽는 법 가이드.
용어 설명
- Reference range: the span of values considered typical, calculated from results in large groups of healthy people.
- Trend: the direction and speed of change in one of your values across several tests taken at different dates.
- Mean cell volume: the average size of your red blood cells, reported in every standard blood count.
- Platelet-to-lymphocyte ratio: a number obtained by dividing the platelet count by the lymphocyte count, both already present on a blood count.
- Unexpected weight loss: weight lost without dieting, illness or any other explanation the person can identify.
- Discrimination: in research, how well a test separates people who have a condition from people who do not.
자주 묻는 질문
Can a normal blood test still hide a problem?
Yes, and this is well established rather than new. A value inside the reference range does not rule a condition out, which is why doctors interpret results alongside symptoms, examination and history rather than in isolation.
How many past blood tests are useful?
At least two are needed before there is any trend to read. The bowel cancer work suggests the informative window is roughly the last two to three years, with older results adding little.
Should I ask my doctor to compare my old results?
If you have a symptom that prompted the appointment, bringing earlier reports is reasonable and often helpful. Asking for extra tests purely to build a trend is not something this research supports.
Does it matter which laboratory ran my tests?
It does. Laboratories use different methods and different reference ranges, so results from different labs are not directly comparable, and using the same one makes any genuine trend easier to see.
Is this a new cancer screening test?
No. It is a proposal for interpreting tests that have already been done, in people who already have a symptom. Recognised screening programmes are a separate matter and continue to apply.
출처
- Blood test trend versus single threshold abnormality to discriminate cancer from non-cancer in patients with unexpected weight loss, PLOS Medicine, September 17, 2026 (PubMed 경유)
- Full Blood Count Trends for Colorectal Cancer Detection (BLOODTRACC), BMC Cancer, 2026 (PubMed 경유)
- Prioritising primary care patients with unexpected weight loss for cancer investigation, The BMJ, 2024 (PubMed 경유)
- A scoping review of unexpected weight loss and cancer, BJGP Open, 2025 (PubMed 경유)
- How to Understand Your Lab Results, MedlinePlus, National Library of Medicine
- Screening Tests, National Cancer Institute
- Blood Tests, Cleveland Clinic
관련 글 더 보기
- 저희 건강 라이브러리에서는 비정상 혈액 검사 결과.
- Another guide explains 전혈구 검사(CBC).
- A further article details 혈액 검사 결과 읽는 법 가이드.
AI DiagMe로 내 검사 결과 이해하기
Comparing a report with the one before it is exactly the kind of reading that is hard to do alone. AI DiagMe turns your laboratory results into plain language, marker by marker, so you arrive at your appointment knowing which questions to ask. AI DiagMe로 내 검사 결과 이해하기.